
Key Concept List: Ch. 1-27
05/26-29 Days 44,45) Senior Final Project Presentations
A44-45:
By 7AM the day of your presentation: Please upload a pdf with the link to (or file of) your Final Project slides. If doing a peer review project, also be sure to “submit” your Google Doc Peer Review Report Preparation Form so that it shows up for me in Schoology.
5/21,22 Day 43) Investigation - Modern Portfolio
Theory
43A:
1) Work on your final project. Make sure you are complying with all requirements
and deadlines outlined on the handout.
FYI - from class: Investigation - Modern Portfolio
Theory
Asset
Allocation Factors, What
is Asset Allocation
Portfolio
Optimization a Primer, Efficient
Frontier, Two
Asset Portfolio
Risk
Level 15 part 1, Risk
Level 15 part 2, Distribution
of Returns Over Time.
Markowitz
Interview
05/19,20 Day 42) Facinating Discoveries with Linear Regression t-tests.
42A:
1) Work on your final project. Make sure you are complying with all requirements
and deadlines outlined on the handout.
FYI: (resources used in the class videos)
Universal Understanding Through Unit Conversions
Edwin Hubble's original paper and data
(Start 5:00 - Stop 8:52) Edwin Hubble, the Expanding Universe, Hubble's Law.
(Start 3:00 - Stop 5:00) Sky at Night - Quasars, Redshifts and Controversy - May 1988
Red Shift or Red Herring? (Primary Redshift Perspective)
Modern calculations for the age of the universe (notice the assumptions changing)
(Start 11:40 - Stop 20:16) Princeton Professor Martin Gilens presentation at MIT. Also his
paper: Testing Theories of American Politics: Elites, Interest Groups, and Average Citizens and a Rebuttal to the Paper
05/18 Day 41) Work on your final project.
41A:
1) Work on your final project. Make sure you are complying with all requirements
and deadlines outlined on the handout.
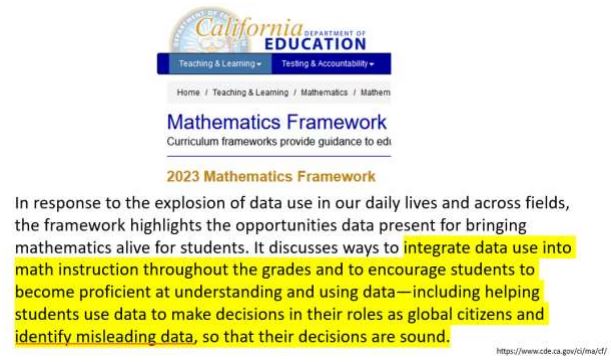
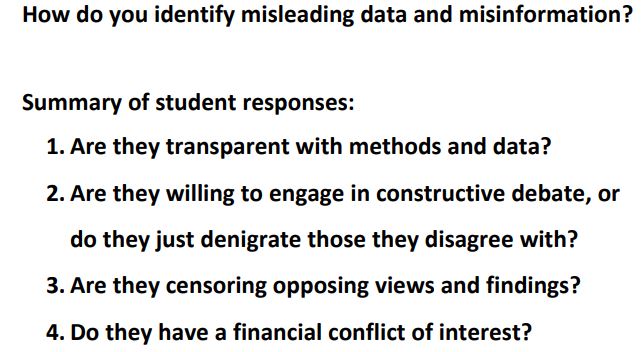
05/14,15 Day 40) Corruption of the Peer Review Process. How do you identify misleading data and missinformation?
40A:
1) Work on your final project. Make sure you are complying with all requirements
and deadlines outlined on the handout.
05/12,13 Day 39) Peer Review Part 2.
39A:
1) Complete page 2 of the peer review class handout. Submit pages 1 and 2 to Schoology.
2) Work on your final project.
05/11 Day 39M) Introduction to Peer Review
39M:
1) Complete page 1 of the peer review class handout.
2) Work on your final project.
05/07,08 Day 38AP) Final Project and The Joy of Stats
38AP:
1) Work on an idea for your final project.
AP Test Resources: Last
Minute AP Exam Review
Historical
FR Questions Table
of Past FR Topic
of Past FR
Key Concept List with AP Exam Highlights Inference Flow Chart
Practice determining the correct inference procedure!
5/7 Thusday AP Statistics Exam!!!
5/05,06 Day 38) Review for the AP Exam.
38A:
A) Complete and submit the class handout station activity.
B) Study for the AP Exam
a) read through the Key Concepts for 1st and 2nd Semesters.
b) study your inference guides.
c) make sure your calculator has new batteries (or is fully charged).
...
Mode: Stat Diagnostics: ON? Y= lists cleared?
C) Get a good night sleep, eat breakfast, and don't be late for your 8am exam!
5/04 Monday Day 38M) Review for AP Exam. FR strategies and name the appropriate procedure.
38M:
A) Complete and submit the class handout reviewing historical free response questions and naming the appropriate procedure.
4/30,5/01 Day 37) Review for AP Exam. FR strategies question #6.
37A:
A) Complete 37D Edpuzzle Investigative Task.
B) Complete both sides of the handout by reading the Last
Minute AP Exam Review
C) Prepare for the AP Exam May 7th!
4/28,29 Day 36) Final Exam (Practice AP Exam MC Section)
36:
A) None.
4/27 Day 36M) Free Response Inference Test Ch. 18-27 with focus on 26, 27
36M:
A) Complete the Final Exam Review Questions in AP Classroom (Due 8AM 4/28,29)
4/23,24 Day 35) Review for Ch.18-27 FR Exam 4/27, Final Exam 4/28,29 and AP Exam.
AP Exam Free Response Strategies
35A:
A) Complete both sides of the handout Prep Book Topic Review - read the pdf in Schoology
B) Complete Edpuzzle 35D AP Classroom Review Session Free Response.
C) Study for Ch.18-27 FR Exam 4/28 and work to finish the AP Classroom MC to earn your final exam curve.
4/21,22 Day 34) AP Exam Test taking strategies - Multiple Choice & Free Response.
Review for Ch. 18-27 FR test next Monday and AP MC Final Exam next Tue/Wed.
34A:
A) Finish the Inference Flow Chart including Assumptions and Conditions.
B) pg. 672-682 / 18, 20, 23. (18 - show all steps including A/C, 20&23 assume A/C OK)
C) Complete the Edpuzzle - Top 10 Tips for AP Exam
D) Continue working on the Final Exam Questions in AP Classroom.
4/20 Monday Day 33M) Review of multiple inference
procedures in preparation for Free Resonse Test Ch. 18-27 with focus on 26, 27 next Monday 4/27.
33M:
A) Check for understanding - Identify the appropriate inference procedure (upload if absent)
B) Make corrections to 32A_B Book problems (using the key in 33M folder)
C) Prepare for Inference Test Ch. 18-27 with focus on 26, 27 4/27 and Final Exam 4/28,29.
D) Continue working on the Final Exam Review Questions in AP Classroom.
Enrichment: Practice determining the correct inference procedure!
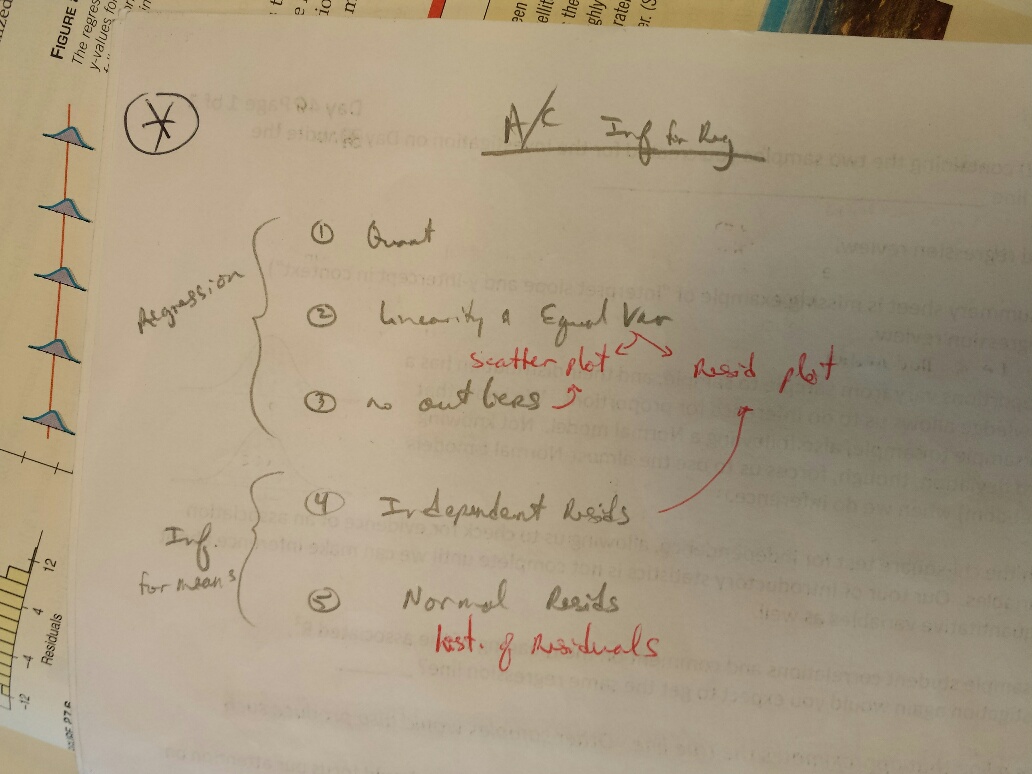
4/09,10 Day 32) Inference for Regression
32A:
A) Submit the completed class notes (pages 1 and 2)
B) pg. 672-682 / 2 (2a is slope), 8, 13(show A/C and all steps), 15.
/* if you get stuck on #2 compare to the answers for #1 in the back of the book. */
C) Read Chapter 27 and Work on the Final Exam Review Questions in AP Classroom.
4/07,08 Day 31)Correlation and Regression
Review. Lead in to Inference for Regresseion.
31A: Assignment 31
A) Complete the Edpuzzle and Inference Guide Regression columns 1 and 2
B) Complete the Correlation Regression Review (TI
Calculator Tips Here)
(keep data in L1 and L2 - don't
delete)
C) Work on the Final Exam Questions in AP Classroom.KEY CONCEPTS:Ch. 1-27
4/06 Day 31M) Chi-Square Quiz
31M:
A) Begin work on the final
exam review problems in AP Classroom.
Units 1-9 Progress Checks MCQ for Final Exam (FR for AP Exam).
4/02,03 Day 30) More practice working with the three types of chi-square test.
30A:
A) Complete and submit page 1 of 30D class notes.
B) pg. 642-648 / 23, 24 (problem 23 think back to what we did at the beginning of the year. We tested for independence with segmented bar charts then with P(A) = P(A|B). Now the independence X2 test provides "wiggle room" to accommodate natural sampling variability.)
C) Complete the Edpuzzle.
D) Finish reading Chapter 26 and prepare for Chi-Square quiz Monday..
3/31,4/01 Day 29) Discover another chi-square test, homogeneity (and the associated TI shortcut - see below). Discover the 3rd chi-square test, independence(see
class notes here). Complete the chi-square inference guide here.
Homogeneity - many groups asked 1 question (question = variable, answers = categories)
Independence - one group asked 2 questions.
29A:
A) Complete the Edpuzzle
B) Complete and submit the class notes.
C) pg. 642-648 / 28, 33, 35 (for all problems - show A/C, make a table showing observed and expected then use matrix and calculator shortcut to find the Chi-Squared value and p-value).
3/30 Day 28M) Chi-square Goodness of Fit continued, learn calculator short cut. Chi-square Inference Guide. Learn the importance of and how to calculate standardized residuals.
28M:
A) Complete the Edpuzzle
B) pg. 642-648 / 9b,c (b assume A/Cs OK and use X2GOF to calculate the answer, for part c compare with the answer for 9a, 10 (Show all steps but use X2GOF instead of making a table)
C) Read Ch.26 p.618-625.
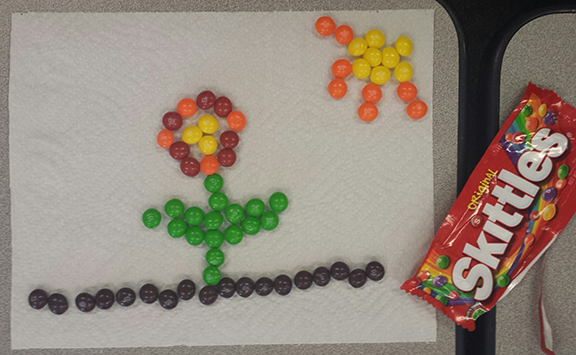
3/26,27 Day 27) Discover a test for an entire
distribution rather than just one proportion.
27A:
A) Complete and submit class notes pages 1-4.
B) pg. 642-648 / 6, 8, 9a. (for 8 and 9a make the table like we did in class for skittles,
also 9a if the ratio is 9:3:3:1 then 9x+3x+3x+1x=100)
C) Read Ch.26 p.618-625.
3/24,25 Day 26) Unit V,VI Test (Chapters 18-25)
A26:
1) None. (Start reading Ch. 26?)
3/23 Mon Day 25M) Review for test next class on Chapters 18-25.
A) Turn in the Day 25M Answer Key if absent
B) Study for Part V+VI Test (Chapters 18-25). next class.
C) Complete practice problems pg. 611-616 / 10, 12, 15, 23.
Optional practice MC problems available in AP Classroom.
3/19,20 Day 24) Finish Matched Pairs Chapter 25
A24:
A) Turn in the 24D completed class notes AND the completed Inference Guide for Quantitative Data.
B) Turn in the Day 25M Answer Key if absent or you didn't finish in class.
C) in class finish pg. 602-608 / 1 (make experimental design flow charts), 9, 11, 15 (conf. int.), 19 (hypothesis test).
D) Read Chapter 25. Prepare for Ch.18-25 Test Tue/Wed.
3/17,18 Day 23) Review Day 20 Test. Comparing
means continued. Column 2 of the Inference Guide for Quantitative Data. (Test on Ch.18-25 next Tue/Wed)
23A
A) Finish reading Chapter 24, Start reading Chapter 25.
B) pg. 579-586 / in class sample size problem, 22 (Show A/C and explain why you must stop!), 31 (don't stop! calculate the p-value with and without the outlier), 34 (show all steps), 36 (assume A/C met). Stinger Tees
Enrichment:
Do masks interrupt or reduce the spread of respiratory viruses? What story does the data tell? Use your AP Statistics tools to evaluate the data. Interview with lead author.
Dr. John Campbell
discussion of the paper and appology.
3/12-13 Day 22) Sample size needed for quantitative data. Comparing
means. "To pool or not to pool" and technology to the rescue
for a wicked degrees of freedom calculation.
22A
A) Submit the completed class notes, pages 1 and 2.
B) pg. 554-559 / 15, pg. 579-586 / 13 (show all steps), 20 (show all steps).
C) read Chapter 24
Enrichment:
Ivermectin shows clinical benefits in mild to moderate COVID19
3/09-11 Day 21) Quantitative
Data, Inference for Means, and the t distribution.
Click here
for another explaination of the Nearly Normal Condition.
21A:
A) complete and submit the class notes pages 1 & 2 (Monday)
B) pg. 554-559 / 1, 5, 9, 13a (just verify the A/Cs), 31 (show all steps – conf. int.), 40 (show all steps - hypothesis test). (Due Wed/Th night).
C) complete the Edpuzzle introduction to inference for quantitative data. (Due Wed/Th night).
Read Chapter 23
FYI: Gosset's Original Student's T article The Probable Error of a Mean and summary.
Fisher's Applications of Student's Distribution
explaination of degrees of freedom: Degrees of freedom, df, is simply an index
of the amount of random variability, mere chance coincidence, that can be present
in a particular situation. Its closest literal translation would be something
along the line of "degrees of arbitrariness."
03/05,06 Day 20) Test on Chapters 18-22.
20A:
A) Relax.
03/03,04 Day 19) Begin reviewing for Ch.18-22 Test (Thursday/Friday). Perfect Pitch.
19A:
A) Review for the Test on Ch. 18-22.
B) Barry Bonds problem, pg. 523-528 / 5, 11, 22, 23, 32(part a - assume A/C OK), 34, 37, 38. pg. 522 / 30 (show all steps)
C) Study for the ch. 18-22 Test next class.
EnrichmentI: Perfect Pitch Example for problem 22 and explanation UCSD, SciAmer.
Remeber: Conclusions for Hypothesis Tests should be 2 sentences:
1st - P-value is __high / low__ therefore we __fail to reject / reject__ the null hypothesis.
2nd - There __isn't / is __ evidence ___(...in context of alternative hypothesis)___.
03/02 Day 18) Begin reviewing for Part 5 Test (Chapters 18-22 Thursday/Friday).
Should you intentionally walk Barry Bonds?
18A:
A) Study for the Test on Ch. 18-22.
B) Begin A19_B review problems for Part 5 Test (Chapters 18-22).
02/26,27 Day 17) Chapter 22 - The difference of two proportions.
17A:
A) complete column 3 of the inference guide and submit your completed inference guide in Schoology.
B) Pages 519-522 / 8 (8d sketch the entire model with empirical rule), 11, 18, 20, 24. (Show A/C for 11b, 18c, and 24a). (Due by the end of class)
C) complete the Edpuzzle. (Due by Sunday night)
Enrichment - extension of problem 11 pets and pesticides - UC Davis investigates autism and pesticides. Link 1, Link 2
02/24,25 Day 16) Skills Check Quiz Chapters 18-21
16A:
A) Complete the skills check in Schoology.
B) Get a head start on Assignment 17 if you want.
02/23 Mon. Day 15M) Hypothesis test for two proportions. Prepare for Ch.18-21 Skills Check next class. Key Concepts Ch. 18-22
15M:
A) Complete the class notes (1 page)
B) Complete the Edpuzzle review for Chapters 18-21.
C) Prepare for Ch.18-21 Skills Check Quiz next class (Tue/Wed).
Enrichment: (evaluate using concepts from AP Statistics)
India Analysis of First 1000 COVID-19 hospitalizations
Ivermectin as Prophylactic in Close Contacts of COVID19_Egypt
Efficacy of Ivermectin on Disease Progression COVID-19 I-TECH Randomized Clinical Trial
FLCCC comments on I-Tech Randomized Ivermectin Trial in JAMA
Meta analysis of 100 studies of Ivermectin for COVID-19
FLCCC The Totality of Evidence
Repurposed drugs for covid (see comparison chart)
02/12,13 Day 15) Quiz - 1 proportion z-test showing all steps.
Explore interactions between
Type I &Type II errors, Power, Effect Size, and Sample Size.
15A:
A) complete and submit the class notes for Day 15 if absent (4pgs).
B) pg. 499-503 / 22, 24, 25, 28
C) Finish reading Ch.21 and prepare for Skills Check on Tue/Wed after break.
Enrichment:
http://www.intuitor.com/statistics/T1T2Errors.html
http://www.rossmanchance.com/applets/Power/Power.html
02/10,11 Day 14) Outcomes and errors
of hypothesis tests.
14A:
A) complete and submit page 2 of the class notes
B) pg. 499-503 / 3, 5, 20, 21.
C) read Ch.21 up to page 493.
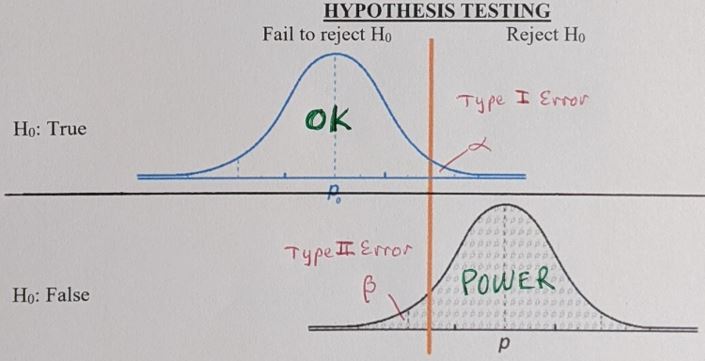
02/09 Day 14M) Alpha Level, when is our sample proportion beyond a reasonable doubt (beyond the expectation of natural sampling variability).
14A:
A) complete page 1 of the class notes
B) read Ch.21 up to page 493.
02/05,06 Day 13) Review Day 12. Day 13 notes pages 1 & 2 to introduce hypothesis testing.
13A Assignment 13
A) Watch the video in Schoology and Complete and submit the class notes pages 1 and 2 by the end of class.
B) Complete and submit pg. 476-479 / 1, 3, 6, 7, 9, 12, 25. (25 show all steps like in the class example)
C) Read chapter 20 and Fill in the Inference Guide
Conclusions for Hypothesis Tests should be 2 sentences:
1st - P-value is __high / low__ therefore we __fail to reject / reject__ the null hypothesis.
2nd - There __isn't / is __ evidence ___(...in context of alternative hypothesis)___.
*Remember: If you're HIGH, Then you FAIL
02/03,04 Day 12) Quiz on Ch. 19. Begin hypothesis testing.
12A Assignment 12
A) Complete the Edpuzzle.
B) Submit the Day 12 notes.
C) Begin reading chapter 20 if you want to get ahead.
02/02 Day 11M) Review for Quiz on Chapters 19 Tue/Wed.
11A Assignment 11
A) Study for the quiz on Ch. 19, review your notes, homework, book, and Notation Review
(Optional Edpuzzle Review in the Day 10 Schoology folder.)
B) page 455-458 / 8, 15, 20, 26, 33, 35.
Enrichment: From early 2020 - Using available data to try and make good decisions. How fast is COVID-19 spreading? Two non peer-reviewed papers create confidence intervals for the R0 of 2019-nCoV:
1) We estimate the basic reproduction number of the infection (RR0) to be 3.8 (95% confidence interval, 3.6 and 4.0)
2) The resulting mean of R estimates is 4.08, as expected, with SD=0.36 (95% CI 3.37~4.77)
01/29,30 Day 10) Certainty vs. precision. Calculating
the n required for ME=? and ? Confidence Level. Notation Review Game.
10A Assignment 10
A) Complete and submit Day 10 notes if absent.
B) page 455-458 / 6, 27, 30.
C) finish reading Ch. 19 (begin studying for Ch. 19 quiz next Tue/Wed.)
(Optional Edpuzzle Review in the Day 10 Schoology folder.)
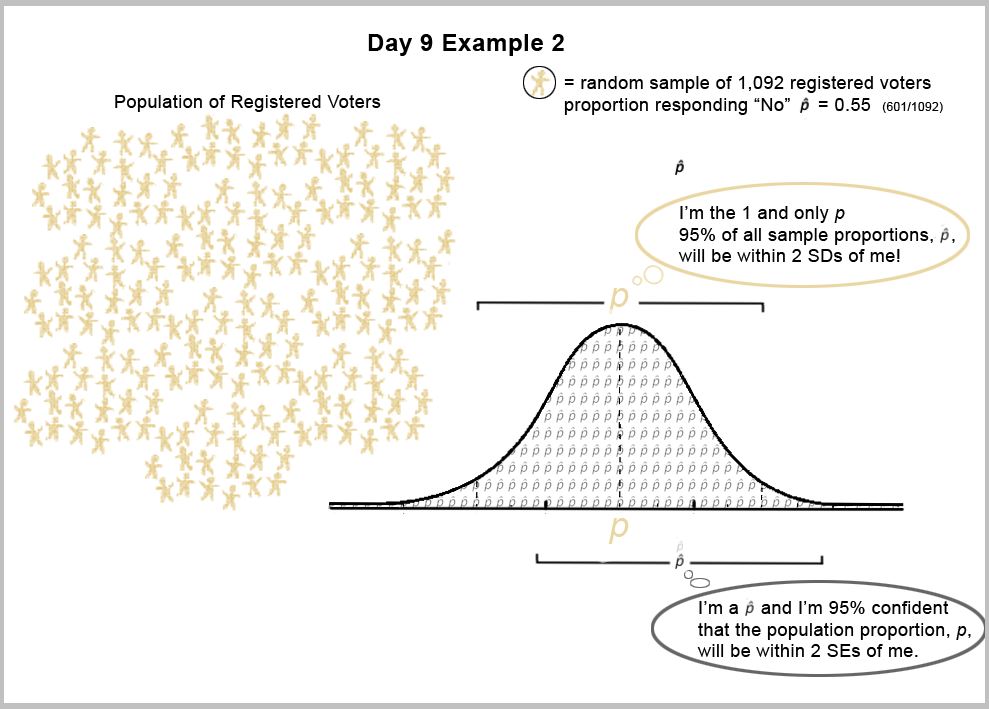
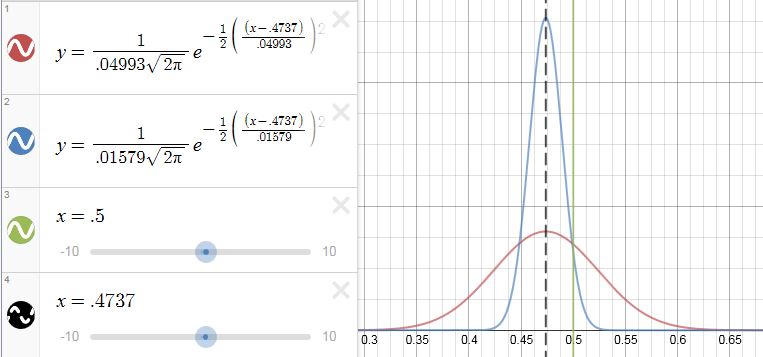
01/27,28 Day 9.5) Inference Guide and confidence interval examples
9.5A Assignment 9.5
A) Complete the 2 problems on the Day 9.5 notes (Submit if absent)
B) page 455-458 / 2, 3, 5, 13, 14, 17, 19, 23 (hints: 17a & 23a show all steps (see inference guide), 19 check A/C and find a reason to stop!)
Enrichment:
Dr. Aseem Malhotra - true benefits and potential harms of mRNA COVID vaccines Pt. 1 & 2
MIT Professor Retsef Levi video message
Meta analysis of 106 studies of Ivermectin for COVID-19
FLCCC The Totality of Evidence
01/26 Day 9M) Quiz on Chapter 18
9M Assignment 9
A) Take the quiz on Ch. 18
B) Fill in the highlighted sections of the Inference Guide and Read Chapter 19
01/22,23 Day 9) Learn
how to create a "p-trap" Otherwise
known as a confidence interval.
Calculating critical values for various
levels of confidence.
9A Assignment 9:
A) Complete and submit Day 9 notes if absent.
B) Complete the 3 Groups of Quiz Practice Questions in AP Classroom, Assign., Upcoming.
C) Study for the Ch. 18 Quiz next class.
![]()
01/20,21 Day 8) Review Test on Ch. 16-17. The law of diminishing returns. Begin ch.19.
8A Assignment 8
A) Complete and submit Day 8 notes.
B) page Pg. 432-438 / 40, 42, 43, 45, 54.
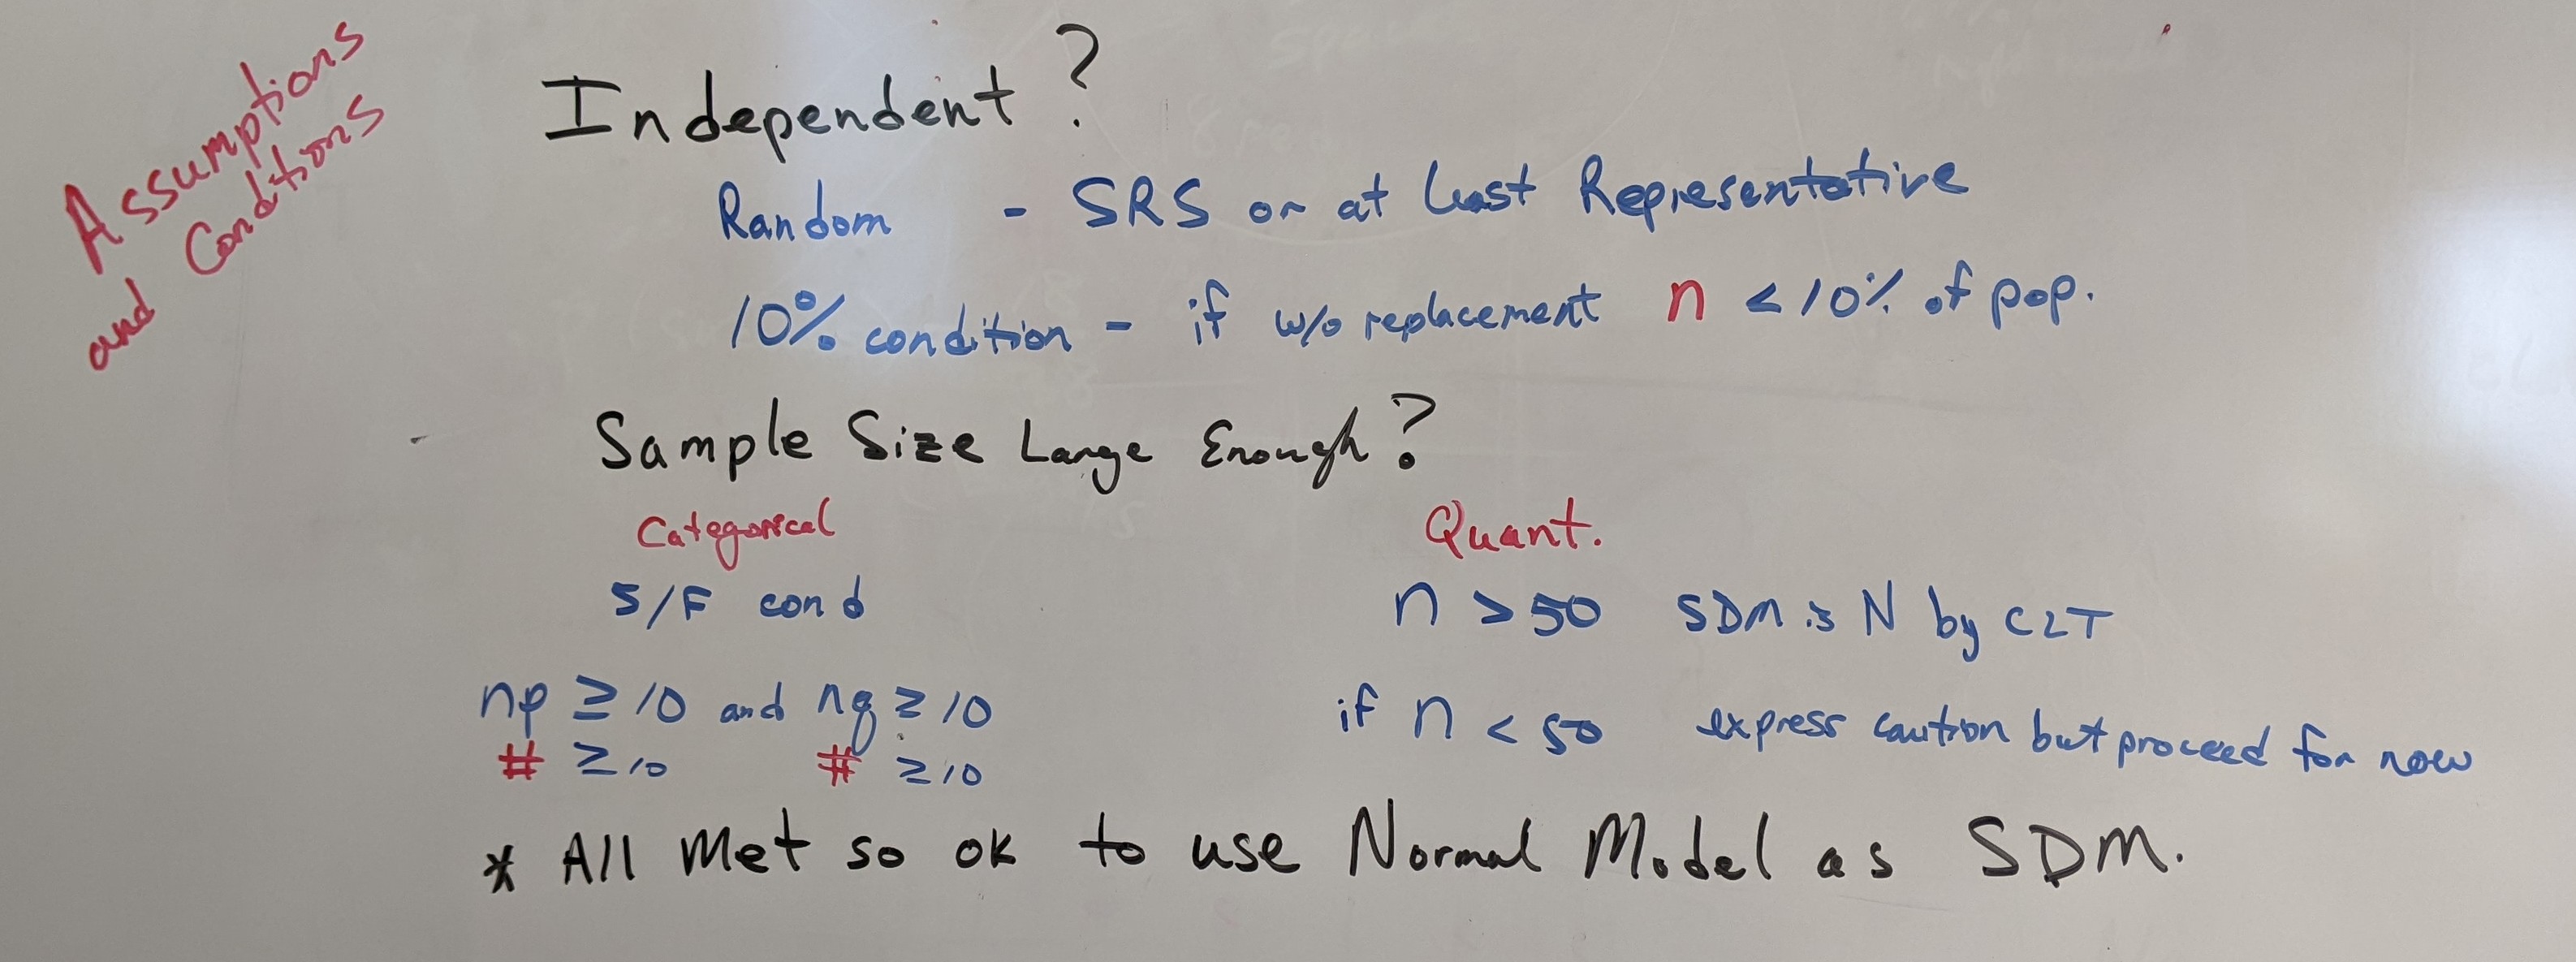
Be sure to memorize the Assumptions and Conditions for using a Normal Model as
the SDM for proportions and means. A hint for porportions:
Indep., Radomdomization, 10%, Sample Size, Success/Failure.
 "I ran 10 same size successful firms"
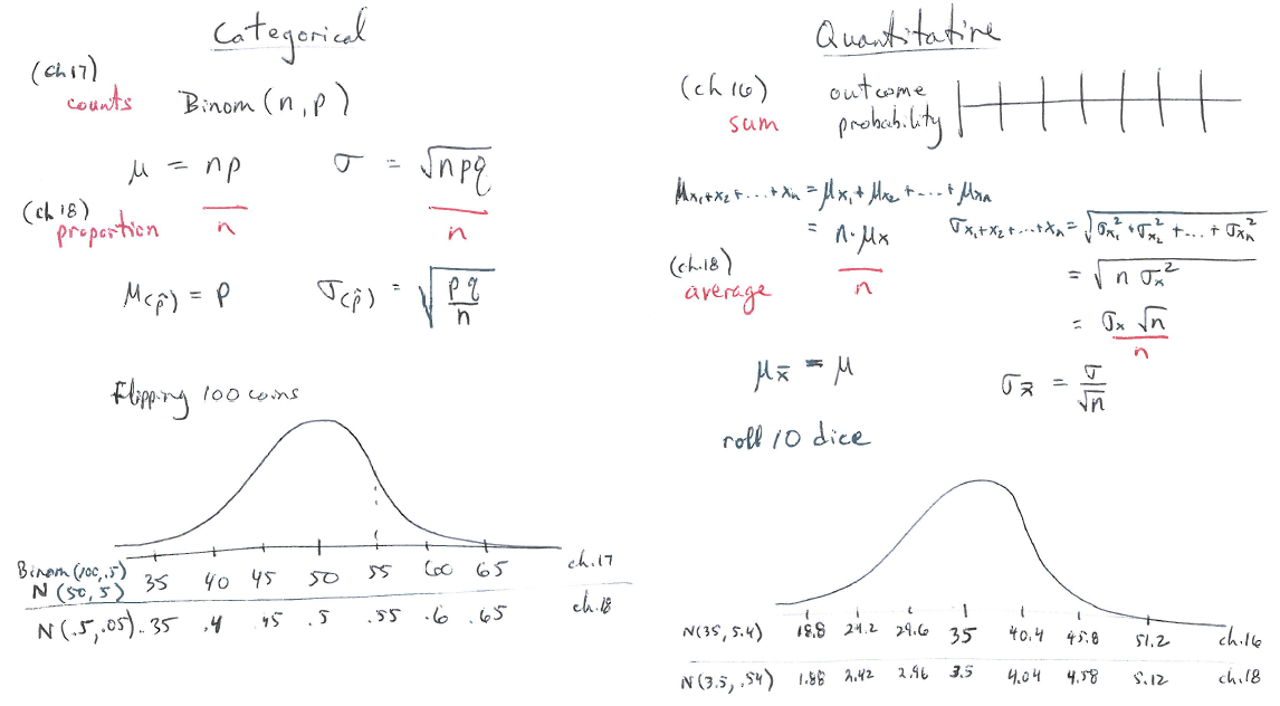
01/15,16 Day 7) Transitioning from binomials to proportions. Sampling distribution models. Transitioning from sums to means. Computer simulations - discovering the Central Limit Theorem, know pg. 429!
7A Assignment 7:
A) Complete and submit pages 1-3 of the Day 7 notes if absent or incomplete.
B) Pg. 432-438 / 16, 26, 27, 28, 33, 37.
Dice App, Central Limit Theorem App, CLT App
01/13,14 Day 6) Quest on Chapters 16 and 17. Begin Ch 18
6A Assignment 6
A) Watch the video and complete the class notes, then upload.
B) Begin reading Ch. 18
Transition from Chapters 16 and 17 to Chapter 18.
Roulette P(winning) 100 vs 1000 plays!
Red = 100 plays, Blue = 1000 plays. Green = break even.
As the number of plays increases the variability _____ and the gambler's chance of leaving without loosing ______ . The way you win at gambling is to be the house. The only rational way to enter a casino is with the mindset, "I am willing to lose $X to purchase entertainment."
01/12 Day 5) Review for Test next class on Chapters 16 and 17.
5A Assignment 5
A) Study for the Test next class on Chapters 16 and 17
B) on separate paper complete and upload pg. 405-410 / 3, 4, 12, 20, 28.
Optional Practice: Kahoot in Schoology and Unit 4 AP Classroom problems.
01/08,09 Day 4) Assumptions and conditions. Determine when we can approximate the Binomial probability model with the Normal model. Check out the binomial distribution applets: Binomial Distribution -Berkeley How to win at gambling!
4A Assignment 3 of 2nd Semester:
A) upload a pdf of your completed class notes for today.
B) on separate paper complete and upload 1) pg. 401-404 / 18, 20, 22, 31, 34. (31&34 approximate with a Normal Model showing the steps we did on page 2 of the class notes.)
C) Finish reading Ch.17, begin preparing for Ch. 16-17 Quest next Tue/Wed.
01/06,07 Day 3) Present your game of chance. Geometric and Binomial probability models.
Learn to use your calculator for Geometric and Binomial probability models.
3A Assignment 3 of 2nd Semester:
A) upload a pdf of your completed class notes for today.
B) on separate paper complete pg. 385 / 38, 40 and pg. 401-402 / 1, 2, 9, 11.
C) Read Ch.17
Enrichment:
Permutations Combinations Review
Proof of the 10% Condition
01/05 Day 3M) Property insurance. Geometric probability models.
3M: Assignment 3M (yes we are starting with Assignment 3) of 2nd Semester:
A) upload a pdf of the front and back of your Game of Chance (counts as ½ a quiz).
B) Start reading Ch.17
Enrichment: The importance of Independence:
The Camp Fire

Credit Default Swaps - 60 Minutes
Read about attempts
to claw back bonuses based on illusory models.
More from Reuters ,
the Economist.
12/16-19 Final Exams
Last day to turn in absent work is 12/15/2025.
12/15 Day 35M) Review for the Final Exam
34A:
Study for the Final Exam. Know the Key Concepts and practice the multiple choice questions in AP Classroom.
12/11,12 Day 34) Probability Histograms. Random variables continued and insurance basics. The Pythagorean Theorem of Statistics. Continuous random variables.
34A:
A) upload a pdf of your completed class notes pages 1-3 for today.
B) on separate paper complete and upload pg. 383-386 / 27, 29, 35, 37 (Due January 8th at 11:59 PM)
C) Study for the Final Exam.
Enrichment: Proof of Sum of 2 Indep. Normal
Random Variables is Normal
12/09,10 Day 33) Random Variables. Greedy Pig take 2. Games of Chance.
33A:
A) If absent, upload a pdf of your completed notes for today.
B) complete and upload pg. 383-384 / 1, 3, 5, 16, 18, 21 (show all steps for #1, others show the model/table then calculator is OK)
C) Read Ch.16 and continue studying for the final exam.
Optional: Begin designing your own game of chance due 1/6,7 (follow the instructions)
Enrichment: explore the variables that determine the cost of earthquake insurance
12/08 Day 33M) Review for Final Exam.
33M:
A) Submit the completed Ch.1-6 Review and Final Exam mixer key concept review.
B)
Study for the final exam. Optional MC review questions are assigned in AP Classroom.
12/04,05 Day 32) Quiz/Test on Chapters 14-15. Begin review for Final Exam.
32A:
Finish 31A_A class notes (except for the Greedy Pig Game)
Consider doing some final exam review questions in AP Classroom (Units 1-4).
12/02,03 Day 31) Probability Simulation
Lab.
31A:
A) Complete and submit pages 1 and 2 of the Day 31 class notes by Sunday night.
B) Study for test on Ch. 14 & 15 Th/Fr (12/5,6),
12/01 Day 31M) Review for Ch. 14 & 15 test (quest) on Th/Fr (12/4,5)
31M:
A) Complete the Edpuzzle
B) pg. 405-410 / 1, 2, 37, 40, 41, 42
C) Study for test on Ch. 14 & 15 Th/Fr (12/4,5), optional - complete the Kahoot and review MC questions in AP Classroom.
11/24,25 Day 30) Disjoint and independence with conditional probability. Tree diagrams. Reversing the conditioning,
Screening Tests.
30A:
A) Submit the completed class notes for Day 30.
B) Pg. 364-365 / [1, 21, 30 make Venn Diagrams], 31, [38, 40, 41, 46 make tree diagrams]
C) Finish reading Ch. 15 and study for Ch. 14-15 Quiz/Test Th/Fri.
Enrichment - review experimental design:
Effect of 1%Povidone Iodine Mouthwash/Gargle, Nasal and Eye Drop in COVID-19 patient
11/20,21 Day 29) Discover the General Addition
Rule and conditional probability leading to General Multiplication Rule.
29A:
A) Upload the completed class notes for Day 29
B) Pg. 361-365 / Using Venn Diagrams when possible 2,4,5,6,10,14,15,19. (Make Venn Diagrams for 2,4,19)
C) Read Ch.15 up to page 352.
11/18,19 Day 28) Test on Ch.11,12,13
A28:
Finish Assignment 28M below.
11/17 Day 28M) Chapter 14 From Randomness
to Probability. Challenger Space Shuttle - redundancy is not a replacement for independence.
28M: (due Wed/Th night)
A) Watch the Edpuzzle and submit the completed class notes.
B) pg. 338-341 / 3,4,5,6,7,19,21,23,25,27,35,36. (probability answers in decimals not %s)
C) Read Ch. 14 and review the Step By Step example.
D) Prepare for Ch. 11-13 TEST NEXT CLASS!
11/13,14 Day 26) Review for Test 11/18,19 on Chapters 11-13.
Review experimental design: Polio vaccines and keeping deer of highways.
26A:
A) Complete and submit Keeping Deer Off Highways.
B) Pg. 317-322 / 1,2,3,4,16,17,18,19 (simulation w/10 trials each w/5 games), 22,25,31,33
C) Study for the test on Ch. 11,12,13 next Tue/Wed.
Enrichment: Compare and contrast polio from 70 years ago with COVID-19 today
The Biggest Public Health Experiment Ever: The 1954 Field Trial of the Salk Vaccine
6 Month Safety and Efficacy of the Pfizer Vaccine
CDC: How Schools and Early Care and Education (ECE) Programs Can Support COVID-19 Vaccination
(See Schoology for Peter Doshi comments on critically assessing biomedical studies)
Harm-benefit analysis of vaccine-related CAEs in relation to COVID-19 hospitalization risk
Subclinical Myocarditis - Report from Switzerland - Vital Findings
Lack of placebo controlled trials for childhood vaccines. /* evaluate validity w/ Ch.11-13 */
11/10,12 Day 25) Experimental Design Ethics. Review experimental design, fish tank problem. Infromed consent in medical experiments. Review Ch. 11,12 Quiz.
25A:
B) Pg. 312-315 / 11,16,17,18, 34, 35.
C) Finish Reading Ch. 13 and begin studing for Ch. 11-13 Test 11/18,19
Enrichment: Ethics
The Tuskegee Experiment: Summary, Government Apology, CDC, Tuskegee
Univ., Tuskegee
Univ., Photos
a) When did it begin and what disease was the Tuskegee
experiment tying to learn more about?
b) What aspects of experimental design were employed in
the Tuskegee experiment?
c) What aspects were omitted?
d) When did the Tuskegee experiment become unethical?
e) When and why was it ended?
f) How did Tuskegee change research practices?
More interesting links:
Standford cancer breakthrough using mice
Parkinson’s
Study – Active Placebo, holes drilled in head.
The Ethics of Placebo Controlled
Trials
Ethical,
Scientific, and Regulatory Perspectives Regarding the Use of Placebos in Cancer
Clinical Trials
Nonconsensual Medical Experiments on
Human Beings
Enrichment: Informed Consent
https://www.fda.gov/patients/clinical-trials-what-patients-need-know/informed-consent-clinical-trials and https://www.fda.gov/media/88915/download
Informed Consent - It's Your Right
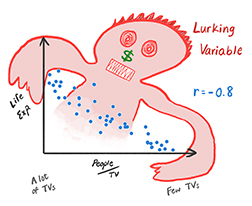
11/06,07 Day 24) Lurking vs Counfounding.
24A:
A) Submit the class notes for pages 1 & 2.
B) Complete and submit the Vocabulary Review Crossword Puzzle
C)
Finish Reading Ch. 13
Enrichment:
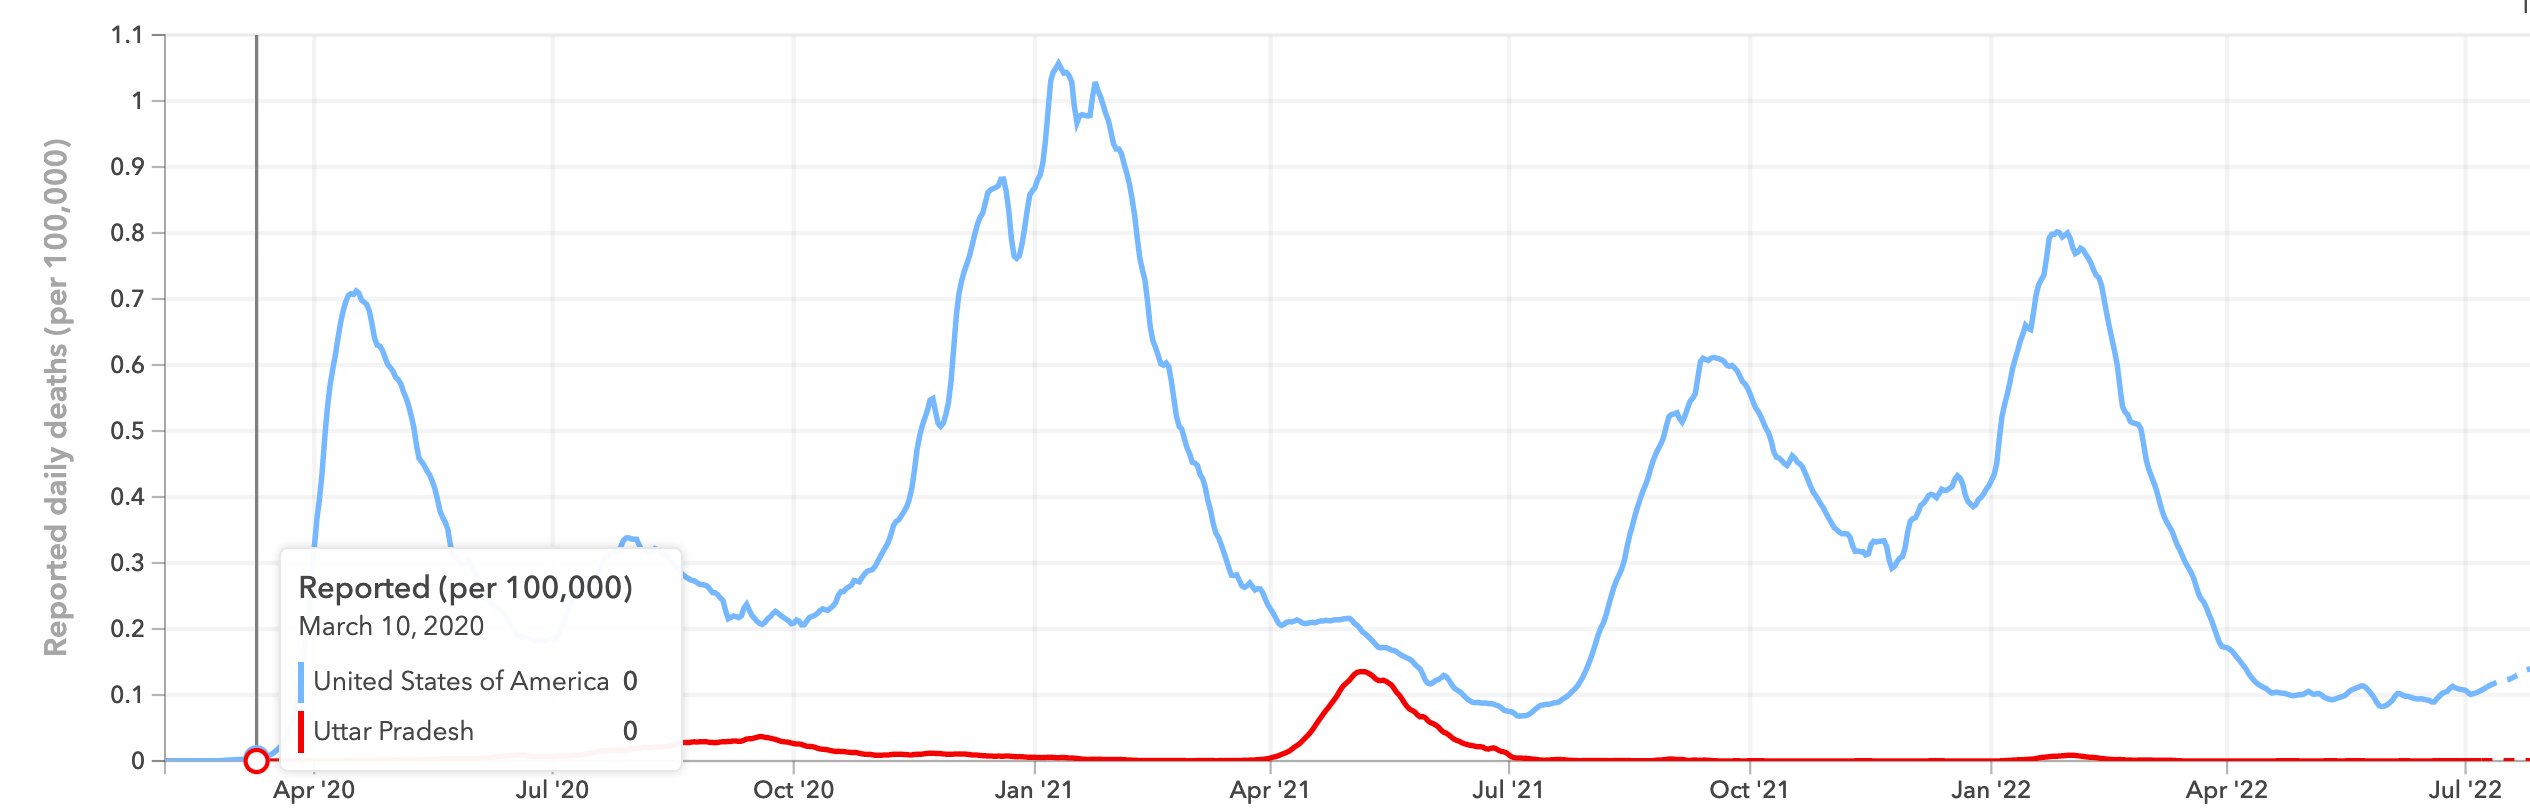
The Miracle Not-Heard Around The World: The Success of Uttar Pradesh Part 1, 2, 3.
11/04,05 Day 23) Chapter 13 Experiments. Retro-Observational study is like detective work.
23A:
A) Complete and submit the Day 23 class notes pages 1 and 2.
B) Pg. 312-315 / 7,8,10,12,29,32,33,36 (33b & 36d- Sketch the experimental design).
Enrichment:
Clinical Profile of First 1000 COVID-19 Cases: An Indian Experience
Physicians' Health Study - Aspirin
11/03 Day 23M) Quiz on Chapters 11 & 12.
Begin Chapter 13 Observational Studies and Experiments.
23:
A) Complete the Edpuzzles and submit the class notes.
10/29,31 Day 22) Review response bias (induced
bias due to question wording or interviewer influence). Review all biases. Review Sampling Strategies - explained with Random Rectangles.
A22:
A) Submit Random Rectangles Part 3 pages 1,2, and 4.
B) Pg. 288-291 / 10,17,19,27,32,35.
C) Prepare for quiz Mon on Chapters 11 & 12. Know your vocab and make sure you know how to conduct a simulation (Who's your buddy?, Biases I hope to . . .).
10/28,29 21D) Continue study design - Sample
Surveys and Bias. Sampling Strategies.
A21:
A) Complete the Edpuzzle and submit class notes page 2 and the random rectangle analysis.
B) Pg. 288-291 / 7, 8, 20, 22, 23, 25, 26.
C) Read Chapter 12.
10/27 Day 21M) Begin study design - Sample
Surveys and Bias.
21M:
A) Complete the Edpuzzle and submit the class notes for page 1.
B) Make corrections to 20A_B (Key is in Day 21M folder).
C)
Begin reading chapter 12.
Biases I hope to N V R C U.
10/23,24 Day 20) Introduction to Randomness.
Random Rectangles and Simulation using randint( ).
20A:
A) Turn in the completed class notes pages 1-3 as a 1 file pdf.
Input your Random Rectangles answers into the GoogleForm using your FUHSD account:
B) Pg. 265-267 / 1, 2, 4, 11, 13, 15, 19, 25, 34 ( 19 & 25 use Pg. A-73 Appendix G for a list of random numbers, 34 use Randint(1,6,2) for rolling two dice. For all 3 be sure to define SCOTR for each then do 15 trails for each.)
C) Read Chapter 11
10/21,22 Day 19) Test on Chapters 7-9
19A:
A) Start reading chaper 11
B) Get a head start on 20A_B book problems.
Enrichment:
Check out www.random.org for more info
about random numbers.
Random number generators. Random numbers with your
calculator. True random vs. pseudorandom numbers Also Using radioactive material to generate random numbers
10/20 Day 19M) Test on Chapters 7-9 next clas. Intro to Randomness.
19M:
A) Classwork: complete the class notes
B) Study for the test next class on Chapters 7-9.
10/16,17 Day 18) Review for 10/25,26 Test on Chapters 7-9 (10/21,22)
18A:
A) Turn in Day 18 pages 1 & 2 of YOUR notes. (your Long Jump with
classmates evaluation)
B) 245-252 / 24, 26, 27, 30, 31
C) Study for the 10/21,22 Test on Chapters 7-9.
(optional) Review the Kahoot practice questions and or AP Classroom Questions
10/14,15 Day 17) What can go wrong with regression continued. What is Chapter 10 about?
17A:
A) Turn in the completed class Day 17 notes – pages 1 and 2.
B) Pg. 214-221 / 1, 6, 29. Pg. 243-244 / 30. and pg. 245-252 /1, 8, 9,
C) Study for 10/21,22 Test on Chapters 7-9. Extra practice available in AP Classroom.
Enrichment: Chapter 10 resources: Solving exponential and log equations, Ladder
of Powers
FYI: Climate Change, you now have tools to help critically evaluate all sides of the issue.
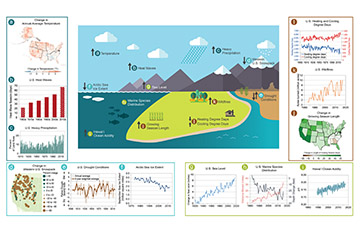
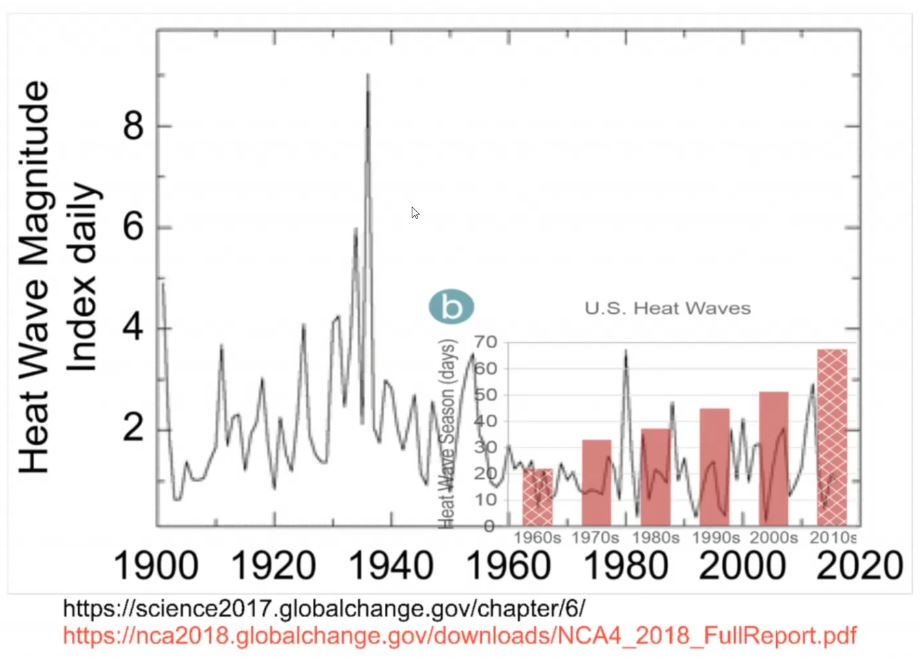 https://data.globalchange.gov/indicator?current=1,
https://www.globalchange.gov/browse/indicators/us-heat-waves,
Princeton's William Happer rebuts myth of carbon pollution.
https://www.youtube.com/watch?v=tul07hx8V8w Could the sun be the major contributor?
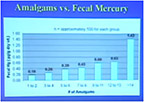
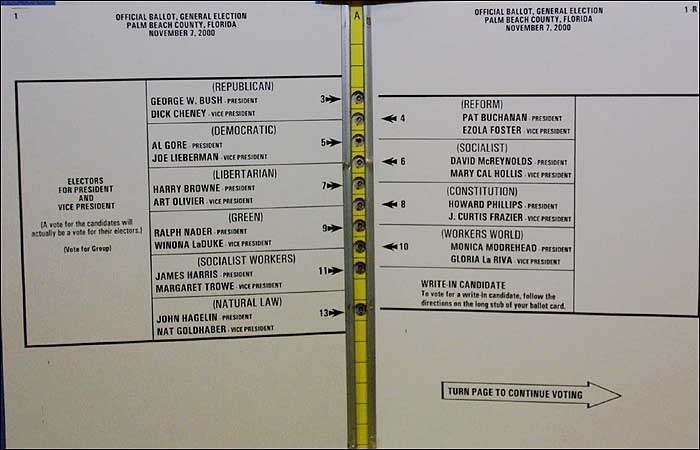
10/09,10 Day 16) Pop Quiz! Then, what can go wrong with regression (continued). Using linear regression to investigate the FL 2000 U.S. Presedential Election and the infamous butterfly ballot. Take a trip to the dentist, amalgams vs. fecal mercury.
16A: Assignment 16
A) By the end of class complete 16D notes pages 1 & 2 + 17D page 2 (we will finish 17D page 1 next week)
B) Complete the 1st half of 17D page 1
C) Read Chapter 9
FYI:
FL Election Results (Excel
97-03) (Excel 2007) (PDF)
View the infamous Butterfly Ballot.
David Quig, PhD - IAOMT presentation: mercury derived from amalgam fillings
(minutes 8:55 - 20:00 pertain to the investigation we did in class.)
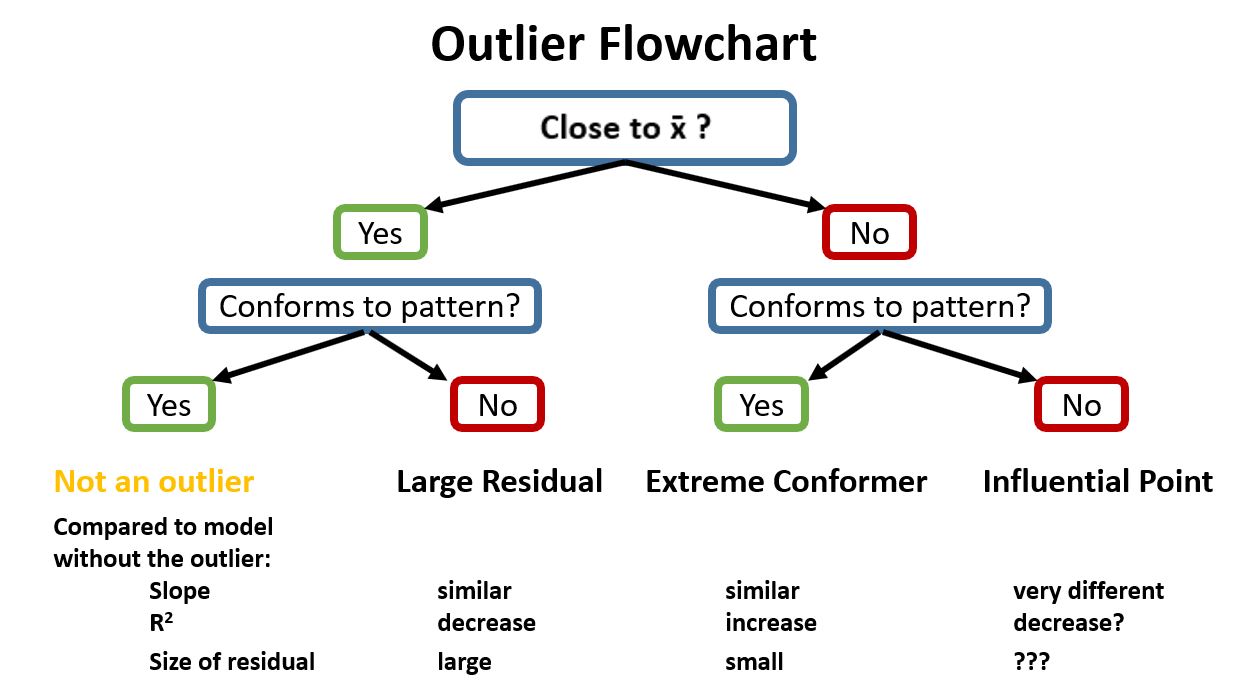
10/07,08 Day 15) What can go wrong with regression.
Learn how leverage and residual produce three flavors of outliers.
15A:
A) Complete page 1 of the Day 16 notes in class (we will finish page 2 on Th/Fri)
B) Pg. 214-221 / 11, 13, 14, 25, 27, 15.
FYI: mix your own flavor of outlier with the Correlation
Regression Demo (be sure to click on the mean-mean line and regression line).
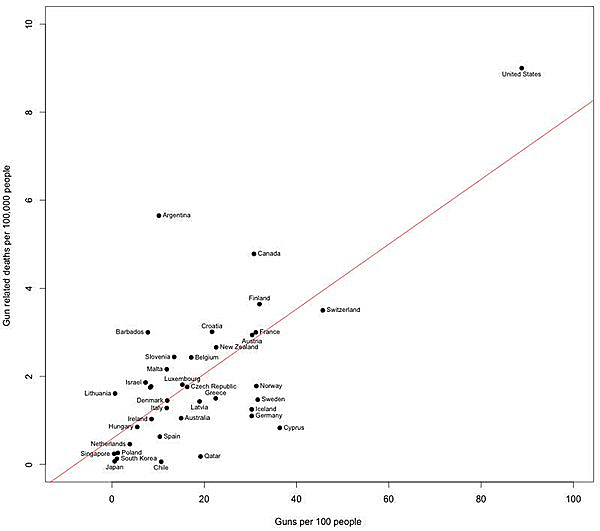
Enrichment:Evaluate real life examples of linear regression and outliers
...................(Gun violence paper 1 & 2 and Covid outbreaks).
Use your knowledge of linear regression to evaluate the paper (and supplement) out of the Harvard Center for Population and Development Studies that finds, "At the country-level, there appears to be no discernable relationship between percentage of population fully vaccinated and new COVID-19 cases in the last 7 days (Fig. 1)."
10/6 Day 15M) Quiz on Correlation and Regression Ch. 7 & 8
15M: (after the quiz)
A) complete the handout activity - The
Wayward Point
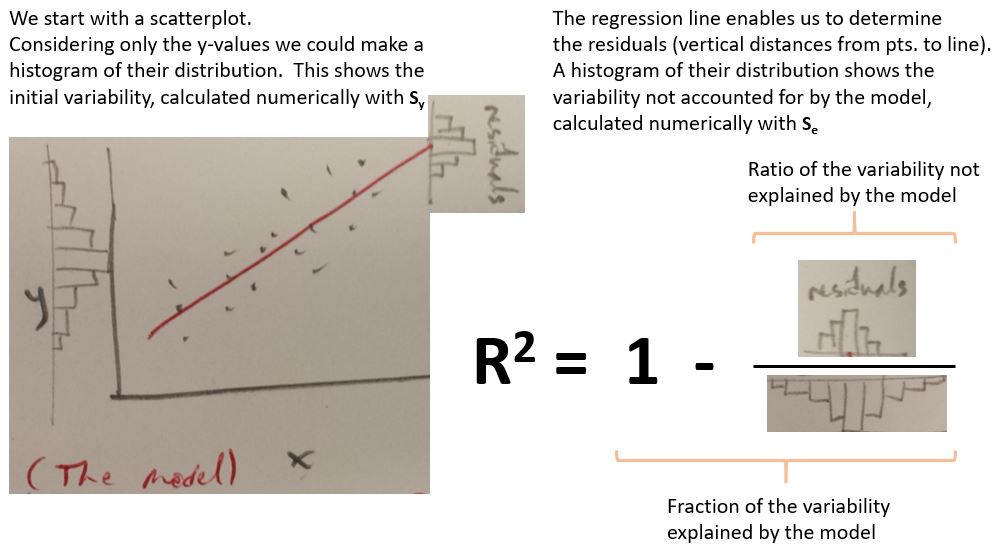
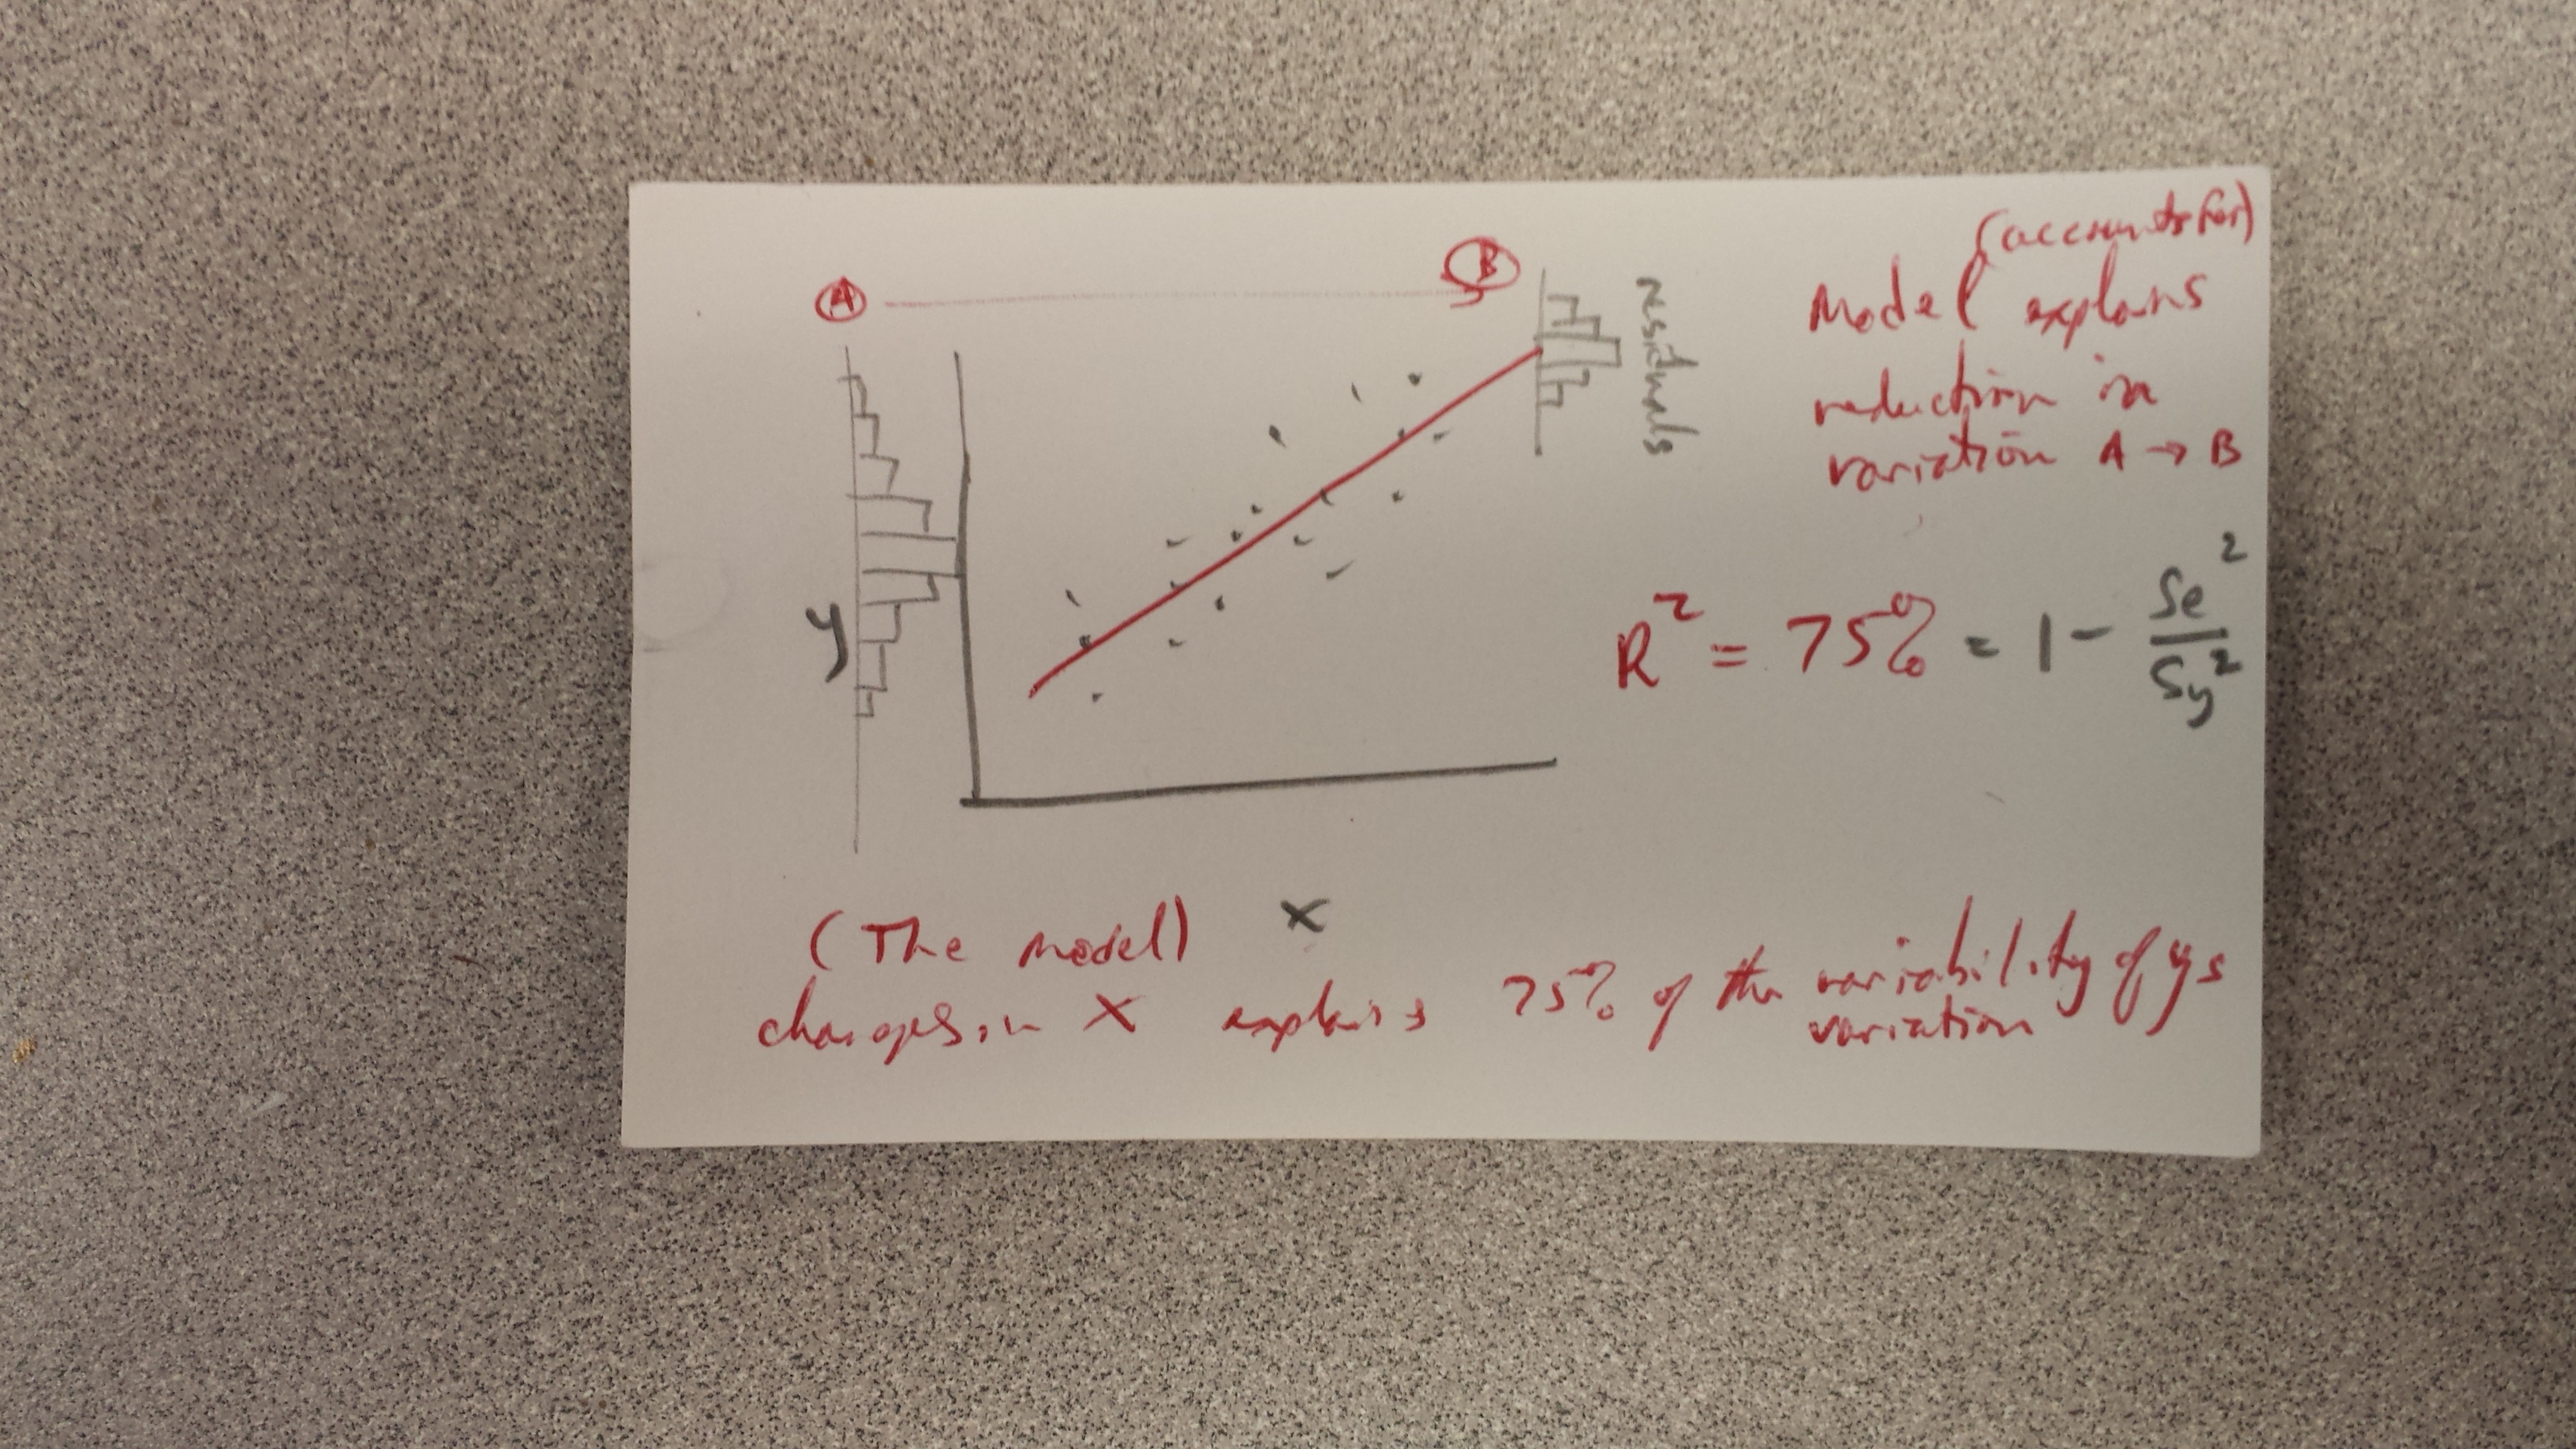
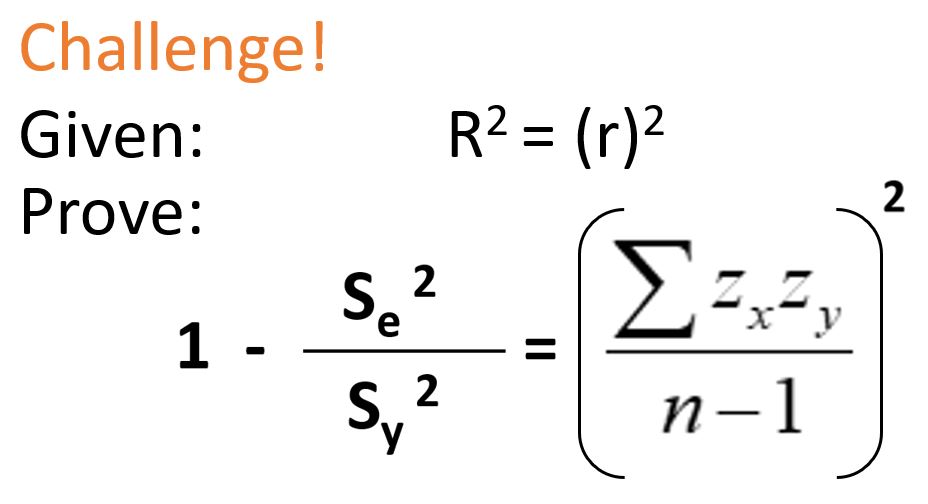
10/02,3 Day 14) Clarify the role of R^2, visual, proof challenge. Check
out this R^2 Animation (Thanks to Shubham who helped me animate the information in the blue box on page 183 of our book).
Discuss the success of the model vs. the appropriateness of the model. Learn
to utilize residual plots. Learn to do it on your calculator.
We can calculate the mean of skewed data, but is it appropriate?
We can calculate the R^2 of non-linear associations, but is it appropriate?
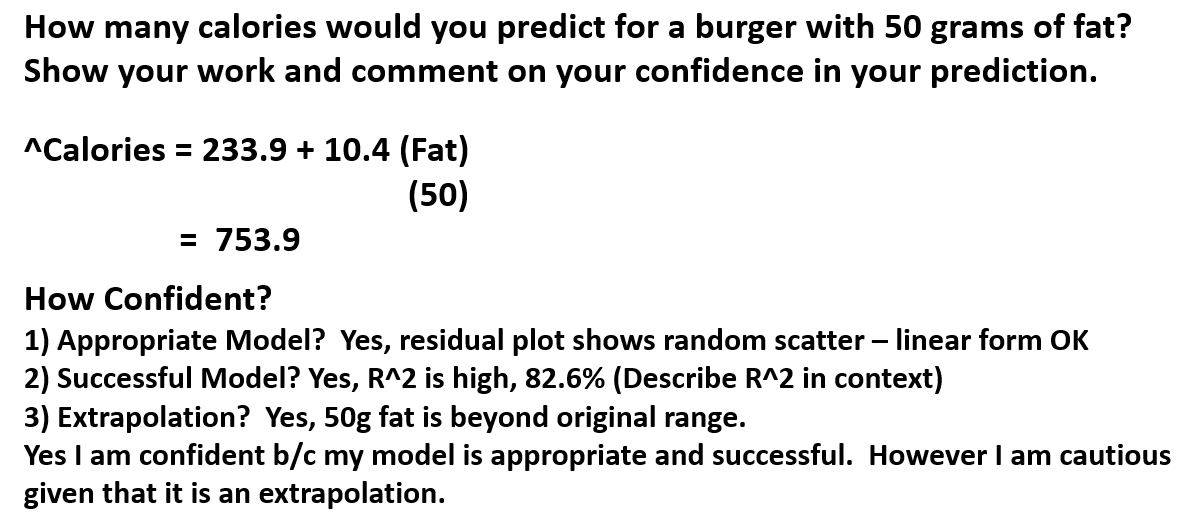
Answering - How Confident are you in your prediction?
14A:
A) Turn in the completed class notes – pages 1 and 2.
B) Complete the problems pg.192-199 / 8,11,27,29,31,54.
C) Study for the quiz on chapters 7 and 8 next class (Days 12-14)
Enrichment:
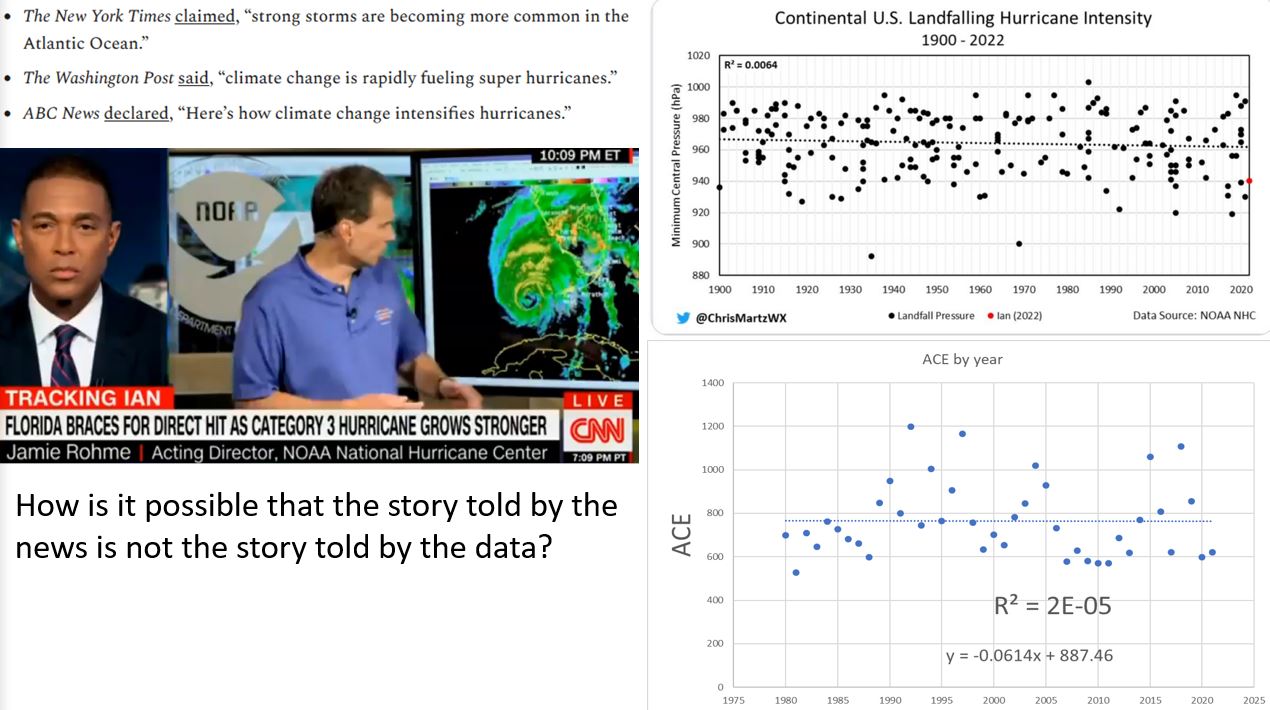
Acumulated Cyclone Energy, Global Warming and Hurricanes.
9/30,10/01 Day 13) How can we use the correlation coefficient to estimate the y value for a given x value? How to write the equation for the line of best fit and other interesting discoveries from doing a BIG proof.
13A:
A) Turn in the completed class notes including problems 1,3,5,7 we did on page 3.
B) Complete the problems pg.192-199 / 14,15,17,19,21,37,42.
C) Read Ch. 8
9/29 Monday Day 12M) Review Test Ch 1-6
12M:
A) Use the key in Day 12M folder to make corrections to 12A_B book problems.
B) finish reading Ch.7 and start reading Ch.8
09/25,26 Day 12) Discover a numerical summary for the strength of the association between two quantitative variables (the spread of points about the form). Be able to calculate correlation coefficients on your calculator.
12A:
A) Turn in the completed class notes.
B) Complete the problems 164-170 / 1, 3, 5, 7, 11, 13, 20, 23, 24, 25, 29, 34, 35, 38.
C) Read Ch. 7
Enrichment: Four Square Multiple Choice _ Plot your own points
Causation? Screen time might boost depression in teens . Full Text of Study
09/23,24 Day 11) Big Test on everything so far this year - Chapters 1-6.
11A - Assignment 11:
A) Complete and submit Monday's handout if you didn't finish it in class.
09/22 Day 11M) Introduction to Part 2
Classwork 11M:
A) finish and submit the handout (available in Schoology)
B) Make correcdtions to A10_A
C) Study for BIG TEST on Ch. 1-6
next class.
09/18,19 Day 10) Review for Big Test next Tue/Wed.
10A:
A) pg. 135-143 / 10, 20, 33, 36, 38. 5, 8 (draw the entire normal model), 14, 25, 27
B) Review for Big Test next Tue/Wed. Review your class notes and assignments from Days 1-10, Chapters 1-6 of your book, as well as the Key Concepts.
Optional practice questions available (assigned) in AP Classroom.
9/16,17 Day 9) Small Quiz on Ch. 6. History of Normal Models.(Galton Board).
Normal Probability Plot.
9A - Assignment 9:
A) Submit completed class notes for 9D pages 1 and 2.
B) get a head start on A10 (Due Sunday night)
C) Review for BIG TEST nexst Tue/Wed
Enrichment: In 1733 Abraham de Moivre, drawing on the work of Jacob and Nicolaus Bernoulli, calculus, and the underlying structure of Pascal's Triangle, demonstrated how a set of random drawings would distribute themselves around their average value. De Moivre's distribution is know today as a normal curve. It makes it possible to evaluate the probability that a given number of observations will fall within some specified bound around a true ratio.
Why pi is in the normal distribution.
9/15 Monday Day 9M) Drawing Normal Models and the Empirical Rule.
Ch. 6 Quiz next class (primarily Ch.6)
9M - Assignment 9M:
A) Complete page 2 of the class notes (we will finish page 1 next class).
B) pg. 131-133 / 25, 26 (25,26 draw the entire model), 31, 32, 44 (draw individual curves and show z score calculations).
C) Read Ch.6 to prepare for a small quiz on Ch. 6 Tue./Wed.
Enrichment:
Proof that 1 standard deviation occurs at the inflection point
09/11,12 Day 8) Journey to Mathmagic Land to discover the power of the Normal Model. Know the cereal example pages 121-123.
8A - Assignment 8:
A) Complete and submit the class notes.
B) p.129-133 / 7, 9, 10, 38, 40, 45 (draw Normal curves for each part of 38,40,45)
Remember N(100, 16) means the mean = 100 and standard deviation = 16 for your z-score calculations.
C) Read pages 116-123.
D) Begin preparing for a quiz on Ch. 6 next Tue/Wed.

9/09,10 Day 7) Quiz Chapters 4 and 5. You can compare ![]() !
!
If you use the standard deviation as a ruler. Begin Ch. 6 Measuring with Standard Deviations. Z-score practice.
7A - Assignment 7:
A) Complete and submit the class notes.
B) p.129-130 / 3, 6, 11, 12, 16, 18, 22.
C) Read pages 104-111.
Enrichment: Check out the official decathlon scoring tables and the theory behind them.
09/08 Mon. Day 6M) Review for Quiz next class (Primarily on Chapters 4 and 5).
6M - Assignment 6M: Warm Up:
Make corrections to A5_B,
A) Complete the in class problems.
B) Complete the Exit Ticket Vocabulary Review.
C) Complete the Decathlon Investigation handout – both sides
D) Review for Tue/Wed Quiz. Study your class notes (concepts/vocab), assignments, and review Chapters 4 and 5 of our book (you can ignore Re-expressing Data pgs 89-91). The quiz will focus primarily on displaying quantitative data and describing distributions numerically but everything covered so far is fair game.
09/04,05 Day 6) Investigate a measure of spread to complement the mean.
Decide when to use which measure of center and spread. Calculators are for calculating aren't they? Learn to find all or our summary statistics with the calculator! Review for Quiz next Tue/Wed. (Primarily on Chapters 4 and 5).
6A - Assignment 6:
A) Edpuzzle – Standard Deviation Theory
B) pages 75-78 / 48,50 (no reports, just write a few sentences) pages 95-100 / #7, 28, 30.
C) Complete the Decathlon Investigation handout –side 1
D) Review for Quiz next Tue/Wed. Study your class notes (concepts/vocab), assignments, and review Chapters 4 and 5 of our book (you can ignore Re-expressing 8Data pgs 89-91). The quiz will focus primarily on displaying quantitative data and describing distributions numerically but everything covered so far this year is fair game.
for newer TI84 users: If your 1-Var Stats input asks for Frequency and you want it to be 1. Then just hit clear and enter.
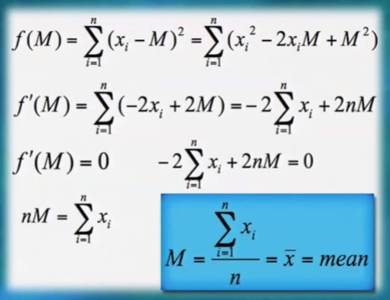
Enrichment: Advantages of the mean deviation, standard deviation proof, and
Why divide by n-1
Denmark: No More COVID Vaccines Offered for Under-50
What does Pfizer's data on 8 mice say about risk/reward of the Bivalent Omicron Booster?
Dr. Paul Offit on mouse data.
UCSF Dr. & Professor Vinay Prasad discusses risk/reward for bivalent (Omicron) boosters.
Part 1 and Part 2
09/02,03 Day 5) Figure out how to describe the distribution of quantitative data numerically. Be able to calculate 5-number summaries and create boxplots. What can a time plot tell you that a histogram cannot? Investigate the El Nino Southern Oscillation.
5A - Assignment 5:
A) complete and submit pages 1 and 2 of the class notes
B) handwritten on a separate piece of paper complete the following 3 parts:
1. Complete the penny problem from class.
2. Think of and list 3 time series that exhibit seasonal
variation. Be sure to describe the cause (or potential
cause) of the seasonal variation.
3. Pg. 72-76 / 6, 8, 10, 42, Pg. 101-102 / 36
C) Join our AP Section on your College Board Account if you didn't last week.
08/28,29 Day 4) Quiz on Part I Chapters 1,2,3. Then continue to investigate ways of displaying quantitative data. The nuances of creating stem-and-leaf displays. Histograms with the calculator and the importance of proper bar width.
Assignment 4: Handouts and Submissions for parts A, B, and C through Schoology
Read your book up to page 52.
A) complete the Edpuzzle
B) complete and submit the class notes
C) complete and submit Pg. 72-75 / 5, 7, 9, 32
D) Join our AP Section on your College Board Account (see Schoology message)
08/26,27 Tue/Wed Day 3) Explore Simpson's Paradox. Review for Th/Fri quiz on Ch. 1-3. Review of Independenc/Association of Real World Data.
3A Assignment 3:
A) (in class) Edpuzzle: check for understanding - book review Ch. 1-3.
B) Study for quiz on Chapters 1-3 Th/Fri
1) Read you book chapters 1-3.
2) Review the Think, Show, Tell format in the Step-By-Step
Example pg. 31-32.
3) study your class notes and vocabulary
4) review your assignments
C) Start Day 4 Th/Fri notes if you want using the Edpuzzle in the Day 4 Schoology folder.
Enrichment:
Real life example of Simpson’s Pardox with COVID-19 data 12:48-14:55
According to the CDC, "education and messaging to help individual persons understand their risk for medically significant illness complements recommendations for prevention strategies based on risk."
Does the FDA think these data justify the first full approval of a covid-19 vaccine?
COVID-19 Vaccine Mandates for Children Obligate Action (lots of links for more information)
Serious adverse events of special interest following mRNA COVID-19 vaccination (pdf)
UCSF Dr. & Professor Vinay Prasad discusses risk/reward for bivalent (Omicron) boosters
Opportunity to compare and contrast as well as interrogate data, A&B vs. C.
A. SARS-CoV-2 Vaccination and Myocarditis in a Nordic Cohort Study of 23 Million Residents
B. Benefit-risk assessment of COVID-19 vaccine, mRNA (Comirnaty) for age 16–29 years
C. Myocarditis after SARS-CoV-2 infection and COVID-19 vaccination: Epidemiology, outcomes, and new perspectives
Do masks interrupt or reduce the spread of respiratory viruses? What story does the data tell? Use your AP Statistics tools to evaluate the data. Interview with lead author.
Dr. John Campbell
discussion of the paper and appology.
College name and vaccine mandate information.
08/25 Monday Day 3M) Review segmented bar charts to determine independence/association of two categorical variables, evaluate the Investigative Task, and review for quiz Th/Fri.
3M Assignment 3:
A) (in class) Watch the Edpuzzle instructions on how to self-assess assignments. Then self-assess 2A_B Smoking and Education in Schoology.
B) (in class) Submit completed rubric review of your partner's Independenc/Association of Real World Data in Schoology.
C) Do pg. 37-43 / problems 15, 16, 22, 36.
D) Study for quiz on Chapters 1-3 Th/Fri
1) Read you book chapters 1-3.
2) Review the Think, Show, Tell format in the Step-By-Step Example pg. 31-32.
3) study your class notes and vocabulary
4) review your assignments
08/21,22 Th/Fri Day 2) Displaying and Describing
Categorical Data, Take a trip on the Titanic. Investigate contingency tables, conditional
distribution, and segmented bar charts, and independence/association between categorical variables. Titanic - Does chance of survival depend on ticket class? COVID-19 - Does chance of survival depend on age?
2A Assignment 2: Submit parts A, B, and C through Schoology
A) Finish the 3 pages of the class notes.
B) Assignment 3 handout (Smoking and Education) (see Ch. 3 example problems for hints)
C) Complete the investigative task Independence/Association in Real World Data on a separate paper. Reference 6 Month Safety and Efficacy Report and Appendix or FBI Crime Data
D) Read Ch. 1-3 of your book in preparation for quiz next Th/Fri.
Enrichment:
American Statistical Assocition - What's Going On In This Graph?
28 Graphs Teach About Inequality
CDC COVID-19 Pandemic Planning Scenarios, Infection fatality rate analysis
Protection and Waning of Natural and Hybrid Immunity to SARS-CoV-2
CDC Update: Summary of Guidance for Minimizing the Impact of COVID-19
Excess mortality attributed to heat and cold (improper scaling of graph)
08/19,20 Tue/Wed Day 1) Why AP Statistics? What to expect from the course and your teacher. Get a taste of statistics being utilized in a real-world setting. Discuss AP Test expectations. Learn to describe data in its context. Investigate types of variables.
Assignment 1:
A) Complete the Green Sheet and AP Statistics Course and Exam Guide scavenger hunt in Schoology.
B) complete all 4 pages of the class notes (in Schoology), including the problems on pages 1-4 if you didn't finish during classtime. Then upload a multipage pdf of pages 1 - 4.
Consider: Genius Scan, Cam Scanner, etc.
C) Read Chapters 1 and 2 of your book.
Enrichment:
08/18 Mon. Day 0 Introduction to AP Statistics (45 min. class)
Organization of course resources, class structure, resources.
0A - Assignment 0: also posted in Schoology with links
A) Discover The Joy of Stats, complete the Edpuzzle in the Day 0 folder.
B) Begin reading Chapters 1 and 2.